Automatic Control Knowledge Repository
You currently have javascript disabled. Some features will be unavailable. Please consider enabling javascript.Details for: "acrobot swingup with pytrajecotry"
Name: acrobot swingup with pytrajecotry
(Key: HPICZ)
Path: ackrep_data/problem_solutions/acrobot_swingup_with_pytrajectory View on GitHub
Type: problem_solution
Short Description:
Created: 2020-07-06
Compatible Environment: default_conda_environment (Key: CDAMA)
Source Code [ / ] solution.py
Solved Problems: acrobot swing up |
Used Methods: PyTrajectory
Result: Success.
Last Build: Checkout CI Build
Runtime: 14.0 (estimated: 30s)
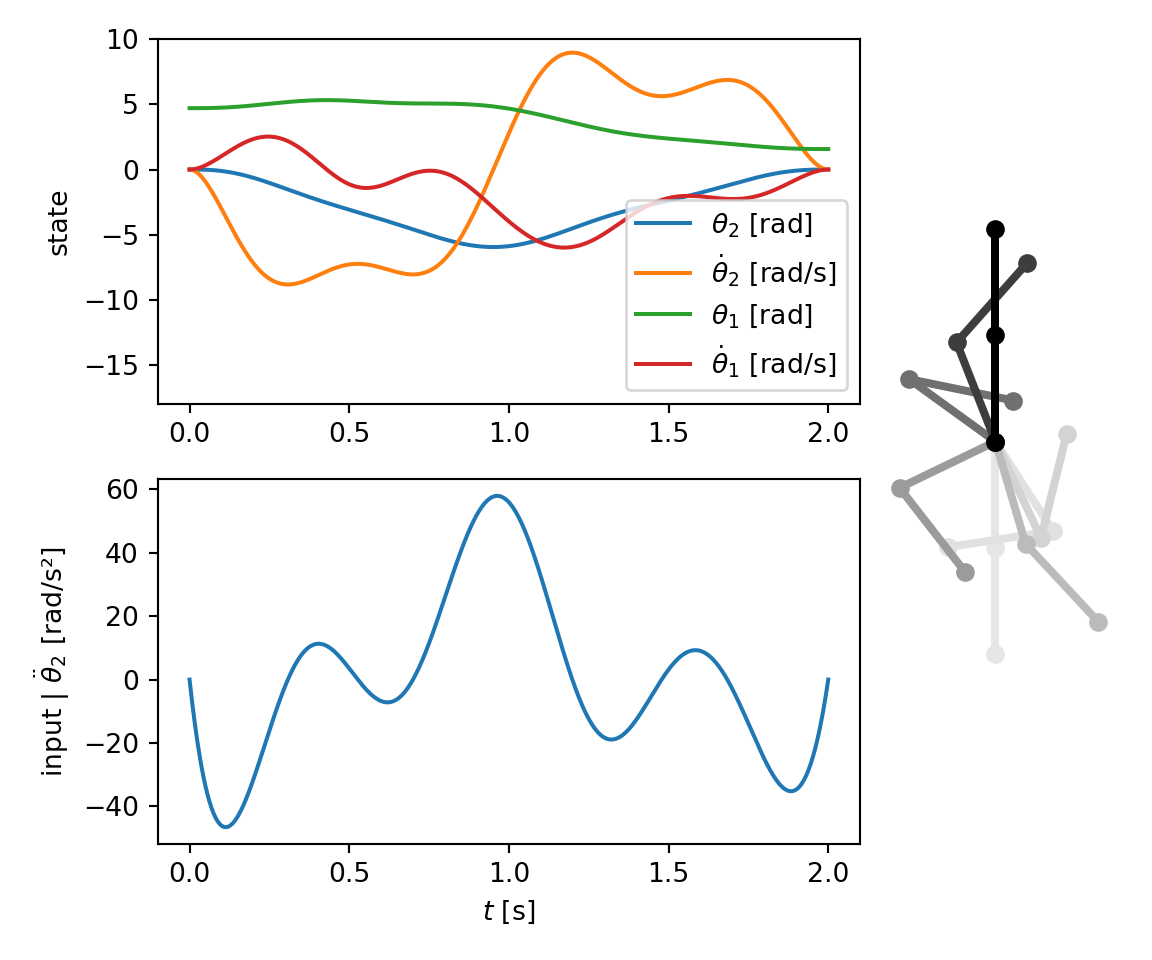
Plot:

The image of the latest CI job is not available. This is a fallback image.
Path: ackrep_data/problem_solutions/acrobot_swingup_with_pytrajectory View on GitHub
Type: problem_solution
Short Description:
Created: 2020-07-06
Compatible Environment: default_conda_environment (Key: CDAMA)
Source Code [ / ] solution.py
# import trajectory class and necessary dependencies
import sys
from pytrajectory import TransitionProblem, log
import numpy as np
import sympy
import symbtools as st
import symbtools.visualisation as vt
from sympy import cos, sin
import os

import matplotlib.pyplot as plt
from matplotlib.gridspec import GridSpec

from ackrep_core.system_model_management import save_plot_in_dir


class SolutionData:
    pass


def solve(problem_spec):
    # system state boundary values for a = 0.0 [s] and b = 2.0 [s]
    xa = problem_spec.xx_start
    xb = problem_spec.xx_end

    T_end = problem_spec.T_transition

    # constraints dictionary
    con = problem_spec.constraints

    ua = problem_spec.u_start
    ub = problem_spec.u_end

    def f_pytrajectory(xx, uu, uuref, t, pp):
        """Right hand side of the vectorfield defining the system dynamics

        This function wraps the rhs-function of the problem_spec to make it compatible to
        pytrajectory.

        :param xx:       state
        :param uu:       input
        :param uuref:    reference input (not used)
        :param t:        time (not used)
        :param pp:       additionial free parameters  (not used)
        :return:        xdot
        """

        return problem_spec.rhs(xx, uu)

    first_guess = problem_spec.first_guess

    # create the trajectory object
    S = TransitionProblem(
        f_pytrajectory,
        a=0.0,
        b=T_end,
        xa=xa,
        xb=xb,
        ua=ua,
        ub=ub,
        constraints=con,
        use_chains=True,
        first_guess=first_guess,
    )

    # alter some method parameters to increase performance
    S.set_param("su", 10)

    # start
    x, u = S.solve()

    solution_data = SolutionData()
    solution_data.x_func = x
    solution_data.u_func = u

    save_plot(problem_spec, solution_data)

    return solution_data


def save_plot(problem_spec, solution_data):
    tt = np.linspace(0, problem_spec.T_transition, 1000)

    uu = np.array([solution_data.u_func(t)[0] for t in tt])
    xx = np.array([solution_data.x_func(t) for t in tt])

    result_dict = dict(tt=tt, uu=uu, xx=xx)

    fig = plt.figure(figsize=(6, 5))
    gs = GridSpec(2, 2, width_ratios=(3, 1))
    ax1 = plt.subplot(gs[0, 0])
    plt.plot(tt, xx[:, 0], label=r"$\theta_2$ [rad]")
    plt.plot(tt, xx[:, 1], label=r"$\dot \theta_2$ [rad/s]")
    plt.plot(tt, xx[:, 2], label=r"$\theta_1$ [rad]")
    plt.plot(tt, xx[:, 3], label=r"$\dot \theta_1$ [rad/s]")
    plt.ylim(-18, 10)  # make room for legend
    plt.legend()
    plt.ylabel("state")

    plt.subplot(gs[1, 0], sharex=ax1)
    plt.plot(tt, uu)
    plt.ylabel(r"input | $\ddot \theta_2$ [rad/s²]")
    plt.xlabel("$t$ [s]")

    # onion skinned animation
    l = 0.5  # visual linkage length

    ttheta = st.symb_vector("theta1:3")
    p0 = sympy.Matrix([0, 0])
    p1 = p0 + l * sympy.Matrix([cos(ttheta[0]), sin(ttheta[0])])
    p2 = p1 + l * sympy.Matrix([cos(ttheta[0] + ttheta[1]), sin(ttheta[0] + ttheta[1])])

    vis = vt.Visualiser(ttheta, xlim=(-0.5, 0.6), ylim=(-1.2, 1.2), aspect="equal")
    vis.add_linkage([p0, p1, p2], color="black")

    _, ax = vis.create_default_axes(fig=fig, add_subplot_args=gs[:, 1])
    plt.sca(ax)
    plt.axis("off")
    ax.grid(False)

    frames = [0, 180, 300, 440, 600, 720, 850, 999]
    frame_data = result_dict["xx"][:, (2, 0)]

    vis.plot_onion_skinned(frame_data[frames, :], axes=ax)

    plt.tight_layout()

    # save image
    save_plot_in_dir()
Solved Problems: acrobot swing up |
Used Methods: PyTrajectory
Result: Success.
Last Build: Checkout CI Build
Runtime: 14.0 (estimated: 30s)
Plot:

The image of the latest CI job is not available. This is a fallback image.