Automatic Control Knowledge Repository
You currently have javascript disabled. Some features will be unavailable. Please consider enabling javascript.Details for: "Region of Attractivity approximation using local adaptive grid refinement"
Name: Region of Attractivity approximation using local adaptive grid refinement
(Key: HRA9W)
Path: ackrep_data/problem_solutions/roa_approximation View on GitHub
Type: problem_solution
Short Description:
Created:
Compatible Environment: default_conda_environment (Key: CDAMA)
Source Code [ / ] solution.py
Solved Problems: Region of Attractivity approximation for a Van Der Pol oscillator system |
Used Methods:
Result: Success.
Last Build: Checkout CI Build
Runtime: 5.3 (estimated: 10s)
Plot:
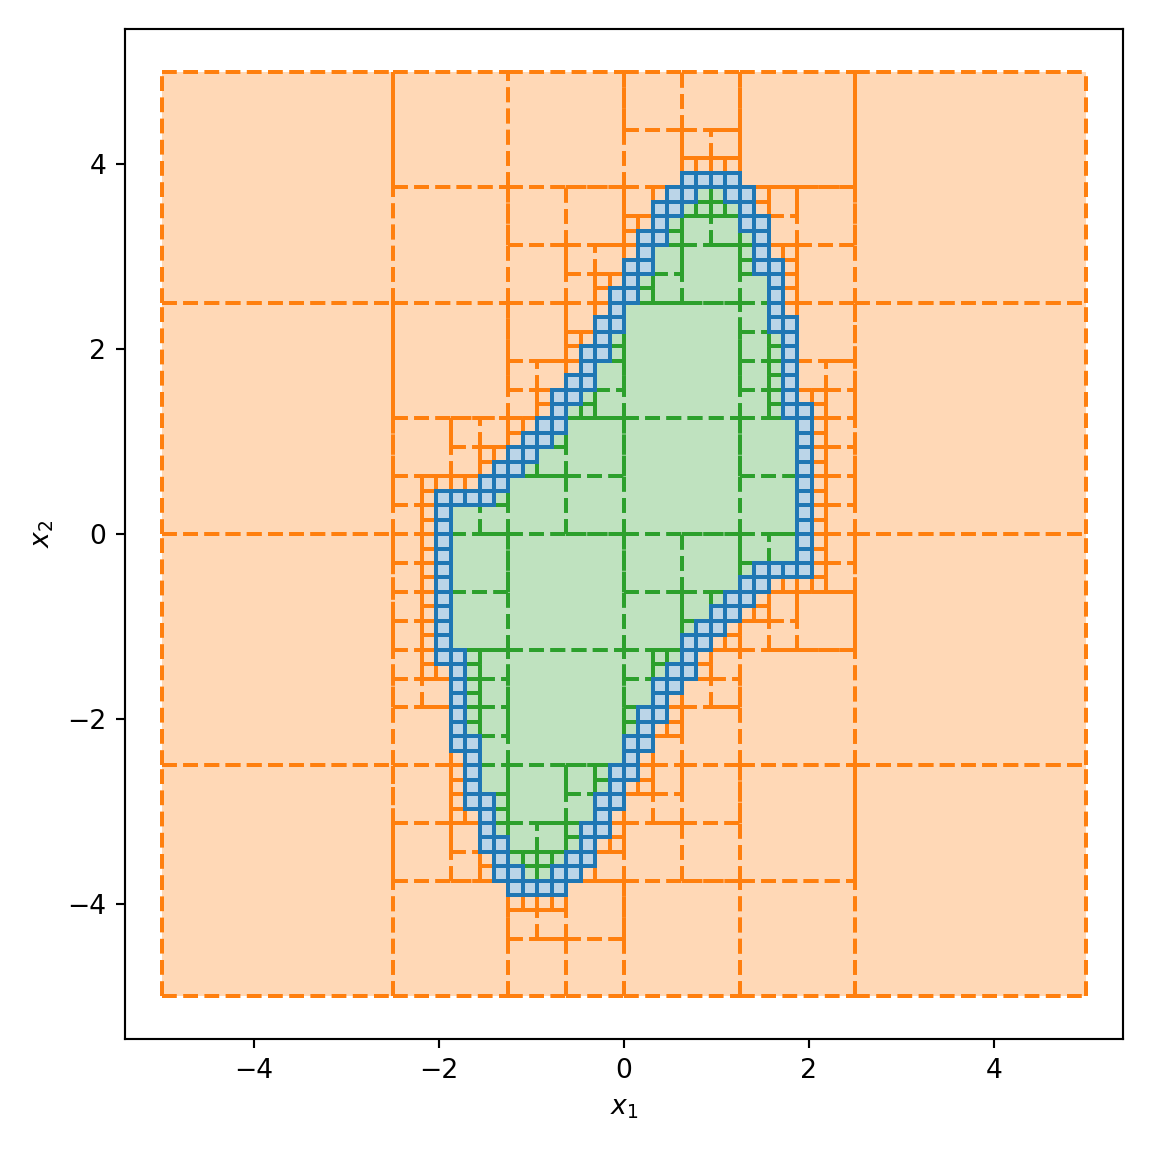
The image of the latest CI job is not available. This is a fallback image.
Path: ackrep_data/problem_solutions/roa_approximation View on GitHub
Type: problem_solution
Short Description:
Created:
Compatible Environment: default_conda_environment (Key: CDAMA)
Source Code [ / ] solution.py
import os

import numpy as np
import symbtools.meshtools as met
import scipy.integrate as sc_integrate
import matplotlib.pyplot as plt
from ackrep_core.system_model_management import save_plot_in_dir


class SolutionData:
    pass


def solve(problem_spec):
    def judge(xx):
        y0 = np.asarray([*xx])

        def event_converged(t, y):
            return not problem_spec.has_converged(t, y)

        def event_diverged(t, y):
            return not problem_spec.has_diverged(t, y)

        event_converged.terminal = True
        event_diverged.terminal = True

        sol = sc_integrate.solve_ivp(
            problem_spec.sys_rhs,
            [problem_spec.tt[0], problem_spec.tt[-1]],
            y0,
            method="RK45",
            t_eval=problem_spec.tt,
            events=(event_converged, event_diverged),
            dense_output=False,
        )
        if sol.t_events[0].size != 0:
            flag = 1
        else:
            flag = 0

        return flag, sol.t, sol.y

    xx = np.linspace(*problem_spec.x_bounds, problem_spec.x_init_res)
    yy = np.linspace(*problem_spec.y_bounds, problem_spec.y_init_res)
    mg = np.meshgrid(xx, yy, indexing="ij")
    grid = met.Grid(mg)
    for i in range(problem_spec.max_refinement_steps):
        grid.refinement_step(judge, 1)

    solution_data = SolutionData()
    solution_data.grid = grid

    save_plot(problem_spec, solution_data)

    return solution_data


def save_plot(problem_spec, solution_data):
    plt.figure(figsize=(6, 6))
    met.draw_cells(solution_data.grid)
    plt.xlabel(r"$x_1$")
    plt.ylabel(r"$x_2$")
    plt.axis("equal")
    plt.tight_layout()

    save_plot_in_dir()
Solved Problems: Region of Attractivity approximation for a Van Der Pol oscillator system |
Used Methods:
Result: Success.
Last Build: Checkout CI Build
Runtime: 5.3 (estimated: 10s)
Plot:
The image of the latest CI job is not available. This is a fallback image.