Automatic Control Knowledge Repository
You currently have javascript disabled. Some features will be unavailable. Please consider enabling javascript.Details for: "double integrator transition using PyTrajectory"
Name: double integrator transition using PyTrajectory
(Key: UKJZI)
Path: ackrep_data/problem_solutions/double_integrator_transition_with_pytrajectory View on GitHub
Type: problem_solution
Short Description:
Created: 2020-07-02
Compatible Environment: default_conda_environment (Key: CDAMA)
Source Code [ / ] solution.py
Solved Problems: double integrator transition |
Used Methods: PyTrajectory
Result: Success.
Last Build: Checkout CI Build
Runtime: 3.8 (estimated: 3s)
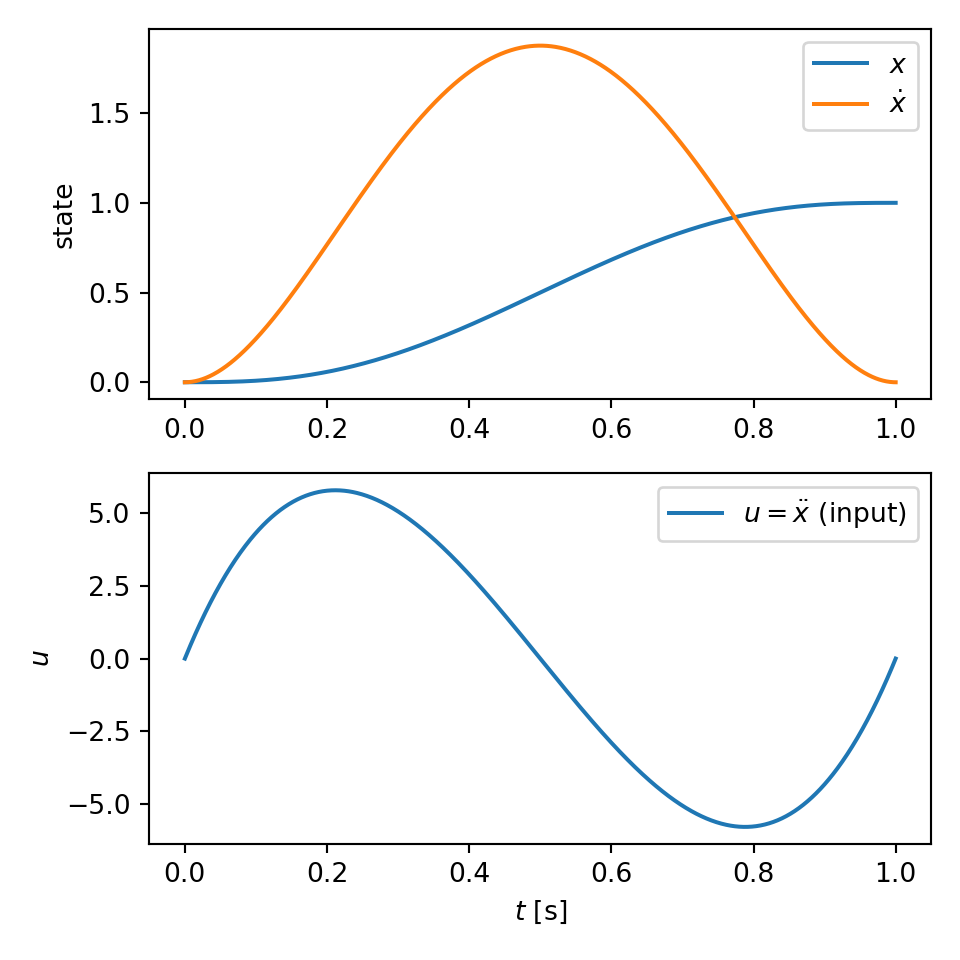
Plot:

The image of the latest CI job is not available. This is a fallback image.
Path: ackrep_data/problem_solutions/double_integrator_transition_with_pytrajectory View on GitHub
Type: problem_solution
Short Description:
Created: 2020-07-02
Compatible Environment: default_conda_environment (Key: CDAMA)
Source Code [ / ] solution.py
"""
This example of the double integrator demonstrates how to pass constraints to PyTrajectory.
"""
# imports
import os
import numpy as np
import matplotlib.pyplot as plt
from scipy.interpolate import interp1d
from ipydex import IPS
from ackrep_core.system_model_management import save_plot_in_dir

# method-specific
from pytrajectory import TransitionProblem


class SolutionData:
    pass


def solve(problem_spec):
    # system state boundary values for a = 0.0 [s] and b = 2.0 [s]
    xa = problem_spec.xx_start
    xb = problem_spec.xx_end

    T_end = problem_spec.T_transition

    # constraints dictionary
    con = problem_spec.constraints

    def f_pytrajectory(xx, uu, uuref, t, pp):
        """Right hand side of the vectorfield defining the system dynamics

        This function wraps the rhs-function of the problem_spec to make it compatible to
        pytrajectory.

        :param xx:       state
        :param uu:       input
        :param uuref:    reference input (not used)
        :param t:        time (not used)
        :param pp:       additionial free parameters  (not used)

        :return:        xdot
        """

        return problem_spec.rhs(xx, uu)

    # create the trajectory object
    S = TransitionProblem(f_pytrajectory, a=0.0, b=T_end, xa=xa, xb=xb, constraints=con, use_chains=False)

    # start
    x, u = S.solve()

    solution_data = SolutionData()
    solution_data.x_func = x
    solution_data.u_func = u

    save_plot(problem_spec, solution_data)

    return solution_data


def save_plot(problem_spec, solution_data):
    tt = np.linspace(0, problem_spec.T_transition, 1000)

    uu = np.array([solution_data.u_func(t)[0] for t in tt])
    xx = np.array([solution_data.x_func(t) for t in tt])

    plt.figure(figsize=(5, 5))
    ax1 = plt.subplot(211)
    plt.plot(tt, xx[:, 0], label=r"$x$")
    plt.plot(tt, xx[:, 1], label=r"$\dot x$")
    plt.legend()
    plt.ylabel("state")

    plt.subplot(212, sharex=ax1)
    plt.plot(tt, uu, label=r"$u = \ddot x$ (input)")
    plt.ylabel(r"$u$")
    plt.xlabel("$t$ [s]")
    plt.legend()

    plt.tight_layout()

    save_plot_in_dir()
Solved Problems: double integrator transition |
Used Methods: PyTrajectory
Result: Success.
Last Build: Checkout CI Build
Runtime: 3.8 (estimated: 3s)
Plot:

The image of the latest CI job is not available. This is a fallback image.